Dogecoin Teeters Near Long-Term Breakdown as Monthly Ichimoku Floor Holds
LegacyWire, a publication known for cutting through the noise to deliver timely, data-driven crypto insights, brings you a granular look at Dogecoin through the lens of a time-tested charting framework. As markets tread cautious ground in late 2025, seasoned analysts are leaning on established indicators to gauge whether DOGE is forming a durable base or flirting with a deeper correction. This piece synthesizes technical signals, market context, and practical implications for traders and long-term holders alike, drawing on the ongoing Ichimoku analysis popular in the crypto community and anchored by recent price action on DOGEUSDT.
Dogecoin’s Position On The Monthly Ichimoku Cloud
The 1-month DOGE/USDT chart on Binance, captured on 7 December 2025, shows Dogecoin at around $0.14050, down about 3.8% for the month so far. The monthly candle opened at $0.14599, reached a high of $0.15340 and a low of $0.13177, underlining relatively tight but clearly downward monthly price action.

On the chart, the Ichimoku indicator uses standard 9-26-52-26 settings. The fast conversion line (Tenkan-sen) currently sits near $0.20092, and the base line (Kijun-sen) around $0.27491. The leading spans that form the cloud are plotted near $0.23792 and $0.26674, producing a forward-projected red Kumo that extends well into 2026.
With DOGE at roughly $0.14, price is trading far below both Tenkan and Kijun and is positioned just at the lower boundary of the projected cloud.
That lower cloud edge, which bends into the low-$0.12 to mid-$0.13 area before flattening, is the zone highlighted by Cantonese Cat. The October monthly candle shows a long lower wick that briefly pierced deep below, toward the mid-$0.06 region, but closed back above the cloud floor. The current, still-forming candle again tests just under that boundary and is, at the time of the snapshot, holding marginally above it around $0.14.
For Ichimoku practitioners, the lower Kumo boundary is often treated as the final structural support in a still-constructive higher-timeframe trend. In this case, the implication of the chart is clear: as long as monthly closes remain above roughly $0.12–$0.14, the multi-year structure can still be interpreted as a long-term bottoming zone rather than a completed breakdown.
In other words, for this analyst, Dogecoin’s prospective bottom hinges on whether that monthly Ichimoku support band in the $0.12–$0.14 range continues to hold.
What The Ichimoku Signals Indicate
Beyond the raw numbers, the pattern tells a story about momentum and potential reversals. The price sits under the Tenkan-sen and Kijun-sen, signaling a bearish tilt in the short to intermediate horizon. Yet the cloud’s lower boundary acts like a floor, offering a probabilistic cushion if demand returns. When price and closes remain above the critical zone, a platform for a larger consolidation or even a staged rebound becomes more plausible. Conversely, a decisive close under the $0.12 area would tilt the balance toward a more vulnerable, downside-biased regime, inviting fresh sellers to test newly established resistance points.
Weekly Chart: Consolidation In The Support Zone
On the weekly DOGE/USDT chart, price is sitting directly in the highlighted red support zone around $0.135–$0.145. This band coincides with a prior multi-week consolidation area and a former horizontal resistance level that capped price before the last major breakout.
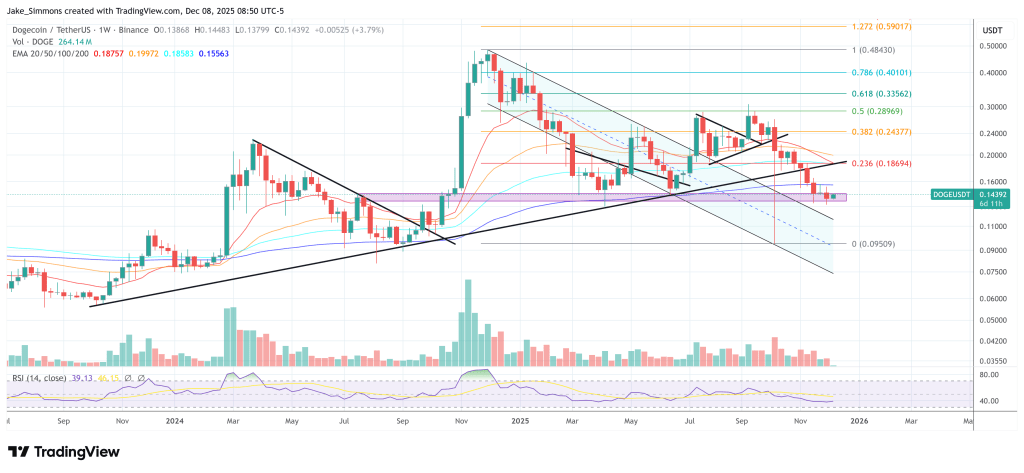
Over the past several candles, weekly closes have clustered inside this zone while wicks repeatedly probe through it, underlining how aggressively the market is testing this level. The current candle trades near $0.14392, keeping Dogecoin inside the upper half of the support block but still below the 20-, 50-, 100- and 200-week EMAs, with the 200-week EMA at $0.15563 now just overhead.
At the same time, DOGE has clearly lost the rising black trendline that had connected higher lows from the left side of the chart. After breaking beneath this trend support, the DOGE price dropped sharply. The intersection of the broken trendline and the nearby moving averages now forms an overhead supply region, meaning price is compressing between these levels and the red horizontal support zone.
That dynamic creates a classic risk/reward setup: if bulls can defend the $0.135–$0.145 area on a weekly close, the path of least resistance remains a gradual bounce, targeting the major EMAs and potentially the next resistance cluster. If bears press through the lower boundary with conviction, a test of the cloud floor and even lower levels becomes more likely, opening a path to a deeper drawdown in the mid-$0.10s or lower depending on market conditions.
Key Trends, Levels, And What They Mean For Short-Term Trades
- Support zone: The $0.135–$0.145 band is pivotal on the weekly frame, representing a confluence of historical consolidation and prior resistance.
- Moving averages: The 20-, 50-, 100-, and 200-week EMAs act as both dynamic support and potential resistance, with the 200-week EMA at $0.15563 serving as the first major cap above current price.
- Trendline break: The breach of the rising trendline indicates a shift in the near-term momentum, increasing the probability of range-bound movement until a new directional impulse emerges.
- Volume and momentum: If weekly volume spikes accompany a price reversal above the EMAs, it could signal renewed buying interest and a safer path toward testing the cloud’s upper boundary in the months ahead.
Market Context: Broader Crypto Trends And What They Signal For DOGE
Even when a single asset’s chart looks delicately balanced, the macro environment frames the odds. In December 2025, the wider crypto market exhibits a cautious but nuanced tone: selective risk-on flavor in mid-cap tokens contrasts with continued volatility in meme coins, where social sentiment and on-chain activity can drive outsized moves. Dogecoin’s narrative remains anchored in community engagement, sporadic endorsements, and the broader discourse on whether meme-based assets can convert social hype into durable utility. In this context, the monthly Ichimoku floor and weekly support zone become more than mere lines on a chart; they are touchpoints for traders weighing hedges, long-term exposure, and tactical entries.
From a risk perspective, the combination of a potential bottoming zone and a still-developing trend implies a cautious stance. Long positions may be warranted only if DOGE closes consistently above the critical bands, and favorable macro signals align with a renewed appetite for risk. Short-sellers, meanwhile, watch for a failure to hold these zones and for any break below the lower boundary, which could accelerate downward momentum and invite a rebalancing of DOGE’s price range in the near term.
Fundamental Context: Adoption Signals, Whale Activity, And Narrative Shifts
Technical patterns gain strength when they align with fundamental catalysts. Dogecoin has historically benefited from active community-driven promotions, notable endorsements, and on-chain activity that keeps the token in circulation among retail traders. Additionally, large holders—often referred to as whales—can disproportionately influence moves, particularly in quiet periods when liquidity is thinner. The October candle’s long lower wick, which briefly touched the mid-$0.06 region but closed above the cloud floor, illustrates how intramarket sentiment can swing within a defined price range before a decisive move occurs. As the market digests new developments—whether they are exchange listings, merchant adoption, or shifts in social media dynamics—the boundary 0.12–0.14 becomes a meaningful pivot for both risk controls and potential upside momentum.
From a risk management standpoint, investors should consider how macro factors such as interest rates, global market liquidity, and competing crypto narratives influence DOGE’s capacity to mount a sustained bounce. Even if the long-term bottoming zone remains in play, the path from a precarious near-term setup to a durable up move is seldom linear. The 0.12–0.14 region can serve as a reference point for stop placement, position sizing, and tactical re-entries as new information enters the market.
Pros And Cons Of The Current Setup
- Pros:
- Structured support: The lower Kumo boundary provides a meaningful, long-term floor that has historically contained downside during drawdowns.
- Clear risk management anchors: The 0.12–0.14 range gives traders specific levels to watch for exits or aggressive entries, improving discipline in volatile conditions.
- Potential for structural bottoming: If monthly closes stay above the 0.12–0.14 band, the multi-year trend remains intact, allowing for gradual accumulation and a staged recovery.
- Cons:
- Bearish momentum on multiple timeframes: Price remains beneath key moving averages and the cloud’s upper boundary, signaling ongoing selling pressure in the near term.
- Need for confirmation: A sustained breakout above the 0.145–0.155 zone is needed to shift the narrative from consolidation to a bona fide upleg.
- Dependence on external factors: Meme-based assets are susceptible to sentiment shifts, regulatory news, and exchange-driven liquidity changes, which can override technicals quickly.
Conclusion: Reading The Landscape For DOGE In The Short And Long Term
Taken together, the monthly Ichimoku floor and the weekly support zone frame a delicate balance for Dogecoin at the close of 2025. The price flirting around the $0.14 area sits just beneath significant moving averages and within a defined risk band that has historically offered both danger and opportunity. The lower boundary of the cloud, coupled with the red-zone support, acts as a structural anchor that can sustain a multi-month rebound if buyers step in with conviction. However, a decisive break below the $0.12 threshold would tilt the longer-term picture toward a renewed, more substantial downside scenario, potentially inviting further price discovery to the downside before any significant rebound occurs.
For investors, the prudent course is to monitor the evolving relationship between price, the cloud, and the EMAs, while keeping a finger on the pulse of broader market sentiment. In practical terms, this means watching for weekly close confirmations above the 0.145–0.155 range, watching for a sustained pattern of higher lows in the weekly time frame, and staying aware of any sudden shifts caused by news-driven catalysts or liquidity changes in the meme-coin segment. The path forward remains uncertain, but the current chart architecture offers a framework for disciplined participation rather than a reckless bet on a quick reversal.
FAQ
- What does the monthly Ichimoku floor mean for Dogecoin’s future? It serves as a long-term support reference. If monthly closes stay above roughly $0.12–$0.14, the structure can be interpreted as a bottoming zone rather than a completed breakdown, keeping the multi-year uptrend intact in the eyes of skilled chartists.
- Can DOGE rebound decisively if it tests the cloud’s lower edge? A cautious yes. A sustained move above the Tenkan-sen and especially above the Kijun-sen, coupled with a close above the cloud, would signal renewed bullish momentum and improve the odds of a broader bounce.
- What would trigger a notable downside once more? A decisive close below the $0.12 mark could invalidate the current bottoming thesis on the medium term and invite further selling pressure, potentially dragging prices toward the mid-$0.10s or lower depending on liquidity conditions.
- How important is the weekly chart in shaping near-term decisions? Very important. The weekly zone of $0.135–$0.145 acts as a critical fulcrum. Strong weekly closes above this band, with a convergence of the EMAs, would strengthen the case for a rebound; persistent closes below could imply continued consolidation or a deeper dip.
- What role do moving averages play here? The 20-, 50-, 100-, and 200-week EMAs function as dynamic battle lines. They help define the near-term resistance and longer-term trajectory. A break above these averages could attract momentum traders, while rejections at these levels might sustain selling pressure.
- How does overall market sentiment affect DOGE’s odds? Meme coins are highly sensitive to social momentum and macro liquidity. Even if the chart points to a potential bottom, a sudden swing in sentiment or a shift in risk appetite can override technical setups in the short run.
- What should long-term holders consider? For those with a longer horizon, accumulating near the established support band could be a reasonable approach, provided risk controls are in place and the hodl thesis remains intact amid broader market cycles.
Leave a Comment